Markets Now - Thursday 6th August 2020
Simply sign up to the Equities myFT Digest -- delivered directly to your inbox.
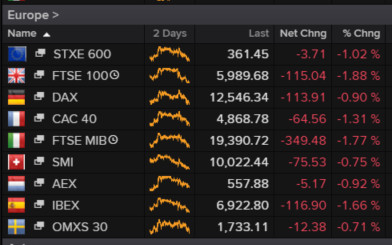
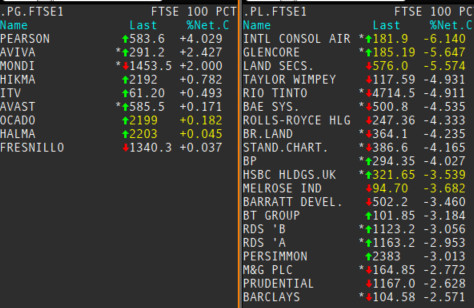
Things are mostly down and there’s a quite lot of news. Sterling, BOE, gold, the Turkish lira and whatnot are covered on the main site. On these pixels we’ll stick with the corporate stuff after a look at the mid-session scoreboards:
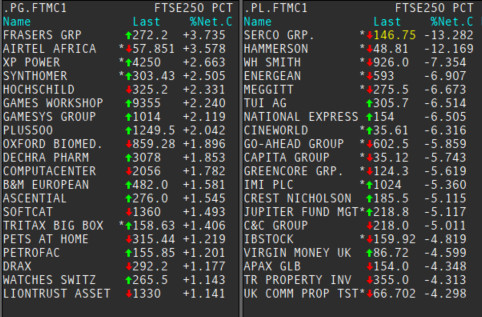
Hammerson’s pressed the button on a £552m rights issue. That might seem not very much at a time when a company can raise $460m by proposing to fire Richard Branson into space, which is an actual thing that’s happening. But then, the second-quarter sunk costs for firing Richard Branson into space were only $63m whereas Hammerson booked a first-half loss of £1.1bn. Based on current burn rates Hammerson could fire ten Richard Bransons into space annually yet the company continues to run shopping centres, which challenges conventional theories about efficient allocation of capital. Here’s Kempen (“neutral”, 78p target):
[Not] a surprise as it was leaked on Monday, but Hammerson plans to raise £525m as well as dispose of its 50% share in VIA Outlets to existing JV partner APG for c.£274m, raising net proceeds of almost £800m. Of course, the raise is highly dilutive (-95% to closing price and -41% discount to TERP) but quite frankly, with the LTV now into the danger zone at 51%, and the transactions market all but dry, there were few other options. The raise does also have the backing of its two largest shareholder APG (c.20%) and Lighthouse Capital (c.14%). Including the sale of VIA, which is expected to complete in 20Q4, proforma LTV should fall to c.42%. But if only the rights issues is successful then LTV would only get back to c.45%.
Another big swipe at the valuations: the next leg down in valuations came with the added pain of the material uncertainty clause, meaning values were down -11.7% l-f-l. This was once again driven by the UK Flagships down -21.1%, followed by France -9.4% (vs URW -4.3% and LI -3.2%); Ireland -9.9%, retail parks 13.3% and Premium Outlets were -5.0%. There was little evidence to go by in the during the period but nonetheless valuers took a stringent view, pushing UK yields up 67bps and ERVs down -5.5% l-f-l. Hammerson no longer report EPRA NAV but NTA fell -21% to 458p as a result of the massive write down.
L-f-l rents down 27%: net rental income fell down to just £87.3m which represents a l-f-l fall of 27% (excluding premium outlets), as a result of covid and the reduced rent collection rate. Again UK flagships were the main culprit down -31% as well as France -30%, Ireland -17%, and premium outlets a massive -50.8%. This led to EPRA EPS of 1.3p, while the dividend remains suspended.
Rent collection behind: Rent collection overall came in at 72%, with 46% for 20Q2, but we expect this to tick up as the year goes on. This overall collection compares to URW 38%, LI 40% for 20Q2. While the 20Q3 collection rate was 34%, versus URW at 50% (including some rental guarantees) and LI at 68%.
Valuation: Hammerson trades at an 84% discount to days NAV and an implied yield nearing 10%, compared to the rest of the sector at -59% and 6.3% respectively. However, this does not tempt us to change our recommendation, and despite a rights issue already being in our numbers we suspect there is still more negative news to come before positivity.
And here’s RBC Capital Markets (“sector perform”, 65p target):
From a first take, the material impact of COVID-19 on Hammerson’s earnings to date is unsurprising in our view. Given the difficulties in achieving disposals in what remains a challenging investment market, Hammerson's desire to raise equity is not a surprise. While the sale of a substantial stake in VIA outlets does offer some near term respite, it comes with the sacrifice of potential future growth and the LTV post disposal and planned rights issue still appears relatively high, in our view. As such, we still believe the headroom on its gearing covenant remains a risk.
And here’s Numis (“sell”, 45p target):
HMSO results were always going to be overshadowed by the rapid erosion in capital values and associated increase in leverage to levels deemed unsustainable, hence the £552m rights issue and disposal of VIA Outlets also being announced. At the same time, earnings have been hammered by tenants not paying rent through CV19 and we expect it to lead to a material rebasing of rents into the future. 1H20 results confirm exactly how tough the outlook is. The key question is whether these actions are sufficient to steady the ship. Assuming shareholders approve both transactions, LTV falls to c.42% (or 45% with just the rights issue). From a covenant perspective, these actions should allow HMSO to move on, but we continue to anticipate an increase in the cost of debt over the next few years given the refinancing profile. The new core areas of focus – UK malls and Ireland – are both capex intensive, in particular its City Quarters strategy; the rights issue buys HMSO time, but it remains dependent on being able to make further sales in a tough and illiquid market in order to finance this capex. We expect the shares to come under significant pressure given the pricing level of the rights issue.
Serco, the relatively acceptable face of government outsourcing, is down on an unexpectedly cautious 2021 outlook. Half-year numbers match expectations and full-year guidance is unchanged. Here’s Barclays:
Overall, in our view, for FY21e the group is striking more cautious (or should that be conservative) tone – pointing to modest growth, implying less than the 7% trading profit growth implied by our forecasts and the 13% implied by consensus. Following recent share price strength, this should l take the edge off an otherwise solid print today.
Longer term, management remains upbeat – Covid results in bigger government and that should lead to more private sector involvement, not less in their view.
New comment on dividends - “If circumstances allow and we can sensibly repay the deferred taxes towards the end of the year, the Board believes that it will then be in a position to consider whether it should distribute all or part of what would have been paid as the final dividend in respect of 2019. Under the same logic, it has also decided to defer a decision on whether we should pay any interim dividend in respect of 2020 until the fourth quarter as well.” We have the group paying a final dividend of 1.50 in FY20e.
And Jefferies for the wider picture:
Interim EPS is in line with consensus and, although FCF is better, this is largely due to timing. The shares have rallied into the results and may succumb to some profit taking today given unchanged FY20F guidance, characteristically cautious FY21F comments and a smaller bid pipeline. Interim EPS is in line with expectations. Turnover £1822.2m (cons £1813m); Adj EBITA £77.6m (cons £77.8m, JEFe £77.7m); adj EPS 3.86p (cons 3.84p, JEFe 3.9p);
DPS 0p (JEFe 0p). The net benefit from Covid19 in the half was £80m revenue with a negligible EBITA contribution. 15% organic revenue growth is slightly ahead of guidance. Organic revenue growth improved from 12% in H219 to 15% in H120 which is slightly ahead of guidance supported by contracts won in 2019, particularly the retendered AASC contract and defence garrison healthcare services contract in Australia. Serco claims a 43% winrate by value for new bids (FY19 40%) and 60% on retenders (FY19 65%) so book-to-bill once again exceeded 100%. The underlying EBITA margin increased by 83bp YoY to 4.26% (JEFe 4.3%).
Strong FCF; Lower-than-expected net debt. June 2020 net debt was £143m (cons £210m, JEFe £188m) and ND/EBITDA 0.7x (JEFe 1.0x). £81m FCF was slightly ahead of our £42m forecast due to timing tailwinds related to debtor collection on two contracts (Track & Trace and FEMA). For modelling purposes, we assume ND/EBITDA improves to 0.4x by December 2021 but bolt-on M&A seems likely which could have a materially positive impact on earnings and FCF. If Serco gears up to its 1-2x target range then there could be c£150-350m available for bolt-ons. Target areas include Australia and US defence, and distressed UK competitors. Fortunately, Serco’s track record is encouraging with the last two transactions covering WACC swiftly.
Bid pipeline falls to £4.1bn. The bid pipeline has declined from £4.9bn in December 2019 to £4.1bn. The majority continues to sit outside the UK, particularly in the US, which has yet to demonstrate the benefit of recent investment in people and capability.
FY20F guidance unchanged; FY21F caution. FY20F guidance for c.£3.7bn revenue, 9% organic revenue growth and £135-150m underlying EBITA has been reiterated (despite a £1.5m increase in FX headwinds since the June IMS). We think Serco already has visibility over c10% organic revenue growth and few retenders but are mindful of Covid19 uncertainty. Despite the better than expected H1, FCF guidance has also been maintained at “broadly similar YOY” (FY19 £62m). FY21F outlook comments are characteristically cautious in nature and stress ongoing Covid19 uncertainty – “These contracts are by their nature short-term, which means they are unlikely to continue much into 2021.”
Glencore numbers are very busy, meaning it wasn’t obvious immediately why the 2020 divi had been axed. The answer is debt rather than trading, which did well out of the oil price volatility, as working capital requirements in the industrial side went up a lot. Here’s Morgan Stanley to summarise:
Glencore’s 1H20 EBITDA was in-line with our forecasts, but ahead of market expectations on better marketing results as hinted last week. Net debt has risen much faster than expected on higher WC outlays, prompting the company to withdraw its dividend. There has been no changes to guidance. EBITDA broadly in-line with MSe but higher vs consensus. Adjusted EBITDA of US$4.83bn was in-line with MSe (US$4.8bn) but higher than visible alpha consensus (US$4.6bn). The beat vs consensus was somewhat expected, given the company’s comments around Marketing EBIT last week. Marketing EBITDA came in 14% above MSe as energy products beat our expectations. On the other hand, Industrial EBITDA was -9% below MSe, as oil division profits missed and corporate costs were higher. Underlying adjusted EBIT of US$1.47bn came in US$0.1bn lower vs MSe of US$1.6bn but higher vs Consensus of US$1.3bn. This variance vs MSe is due to higher depreciation. The company has also booked US$3.2bn in impairments net of taxes and minorities and is recognized within Colombian coal, Chad oil, African copper and Peruvian zinc portfolios. However, clean EPS came in much higher at US$0.06/share compared to MSe of US$0.025/share due to lower finance expense and tax credit. Dividend dropped as priority given to Balance Sheet. Against our expectations that Glencore would resume a (reduced) dividend of USc10/share in 2H20, the company has decided to drop the dividend altogether. This decision has likely been driven by the company’s focus on reducing financial leverage.
Cash flow missed on higher working capital, leading to US$1.7-1.8bn higher net debt. FCF came in significantly lower than our forecasts (-US$1.88bn vs MSe at -US$0.14bn) on the back of a much higher build-up in working capital (lower oil payables). As such, reported Net Debt came in at US$19.7bn (Glencore definition) that included a US$0.4bn rise in market leases. Net funding came in at US$36.4bn which was US$1.7-1.8bn higher than we expected. Year-end Net Debt targeted below US$16bn (excluding Marketing related lease liabilities of US$0.9bn). This would necessitate a FCF of ~US$2.8bn in 2H20, implying a working capital release of ~US$1bn on spot - assuming no proceeds from asset sales. Capital expenditures in 2H are guided at US$2.3bn, implying an annual budget of US$4bn (previous guidance US$4-4.5bn). All unit cost and volume guidance were kept unchanged.Shares trade on 2021e 6.3x EV/EBITDA and 12.0% FCF on spot prices vs diversified peers at 4.4x and ~11%, respectively.
And Jefferies:
Coal price weakness hurts, but lower costs and higher base metals prices should lead to net debt reduction in 2H and a reinstatement of the dividend in 2021.
Oil Trading Windfall Offsets Negatives in Industrials and Coal: Glencore’s 1H20 Marketing EBIT of $2.0bn more than doubled vs 1H19 due to a $606m increase in Energy Products (mostly oil) and a $439m increase in Metals and Minerals (1H19 was impacted by a $350m mark-to-market loss in cobalt). Guidance is for full year Marketing EBIT to be at the top of the $2.2-3.2bn through-cycle range, although we believe a beat of the high end of the range is likely. Industrial EBITDA of $2.6bn (down 42% y/y) was negatively impacted by lower commodity prices and especially by the collapse in coal prices but should improve in 2H due to higher base metals prices. The $2.1bn increase in net debt in 1H20 can be attributed to a $3.25bn cash outflow for working cap as payables decreased by $6.0bn, mostly due to oil trading. Mgmt believes it can get to the targeted net debt range of $10-16bn by the end of this year due to a recovery in Industrials EBITDA and cash inflows from non-RMI working capital as the imbalance between payables and receivables from 1H should at least partially reverse. As deleveraging is once again the priority, the board has scrapped the 2020 dividend.
Dividend Cut is a Missed Opportunity: Deleveraging should be a priority as net debt of $19.7bn ($18.8bn ex Marketing leases) is too high, in our view. However, based on Glencore’s illustrative FCF of >$2bn for 2H at today’s spot prices as well as the partial reversal of the non-RMI working capital build in 1H, net debt should fall to well below the top of the targeted range by year-end. Glencore’s policy had been to pay a base dividend of $1bn from Marketing cash flow plus 25% of Industrials FCF. The strength in Marketing EBIT in 1H clearly justifies the $1bn base dividend, and the payout ratio based portion of the dividend from Industrials is by definition designed to enable the company to flex the dividend lower at weak points in the cycle. Yet the dividend has been scrapped anyway. We believe Glencore has missed an opportunity to send a strong message to the market about its dividend policy being robust through the cycle.
Coal is Still a Structural Problem: Glencore’s large thermal coal business is a point of differentiation, but it is also an overhang on the company’s valuation due to poor fundamentals and ESG concerns. Even if coal prices recover, we are concerned about thermal coal leading to a further derating of Glencore EV/EBITDA multiple. We believe a spinoff/demerger of the business would drive a re-rating and will happen when coal markets improve.
Valuation and Rating: On our estimates, Glencore trades at a 2020 EV/EBITDA of 4.6x and a P/NPV of 0.9x. We are bullish the cycle, but we reiterate our Hold rating on GLEN shares.
ITV’s up a tad. Its H1 profit’s better on cost savings, which probably should’ve been predicted given the lack of new programming, but the improvement in advertising’s not coming through with any conviction. UBS can do the headlines:
Q: How did results compare vs expectations?
A: Beat across the board. H120 group revs fell 17% to £1218m beating expectations (cons: £1162m, UBS £1174m). Broadcast & Online revs were down 17% to £824m (cons €810m, UBS £808m) with Q2 TAR down -43% (UBS -45%). ITV Studios total sales fell -17% to £630m (Cons £582m, UBS £584m) with external sales down -18% to £397m (cons £352m, UBS £366m). Adjusted EBITA fell -50% to £165m (cons £137m, UBS £132m) with Studios £62m (cons £57m, UBS £56m) and Broadcast £103m (cons £80m, UBS £77m). Net debt was £783m or 1.3x Adjusted EBITDA. ITV has good access to liquidity £385m in cash, £630m undrawn RCF and £300m bilateral facility.
Q: What were the most noteworthy areas in the results?
A: Q220 TAR was -43% broadly in-line with original guidance with Apr -42%, May -46% and Jun -42%. Total viewing was up 4% with online viewing +13%, ITV’s family SOV was down 4% impacted by the volume of BBC’s news output. Britbox is ahead of target (although no numbers) and will launch internationally. In H120, ITV delivered £51m in cost savings vs. budgeted FY20 savings of £60m. In Studios 230 productions were impacted with around 70% delivered or to be delivered.
Q: Has the company’s outlook/guidance changed?
A: Given the level of uncertainty ITV was unable to provide guidance for Q3 or FY20. However, they are now guiding to £960m in schedule costs down from £990m. Additionally, ITV indicated TAR in July is down -23% with August improving again.
Q: How would we expect investors to react?
A: Positively although: 1) the H120 beat is largely cost and timing driven (production deliveries); 2) potential cuts to H220 Studios revs and margins exist due to ongoing Covid production challenges although these should be offset by lower schedule costs (£30m); and 3) July August TAR trading while improving are still negative.
And for the more detailed take here’s Ian Whittaker, who’s between roles having left Liberum at the start of June:
Advertising trends look to be improving: Total Advertising Revenues (TAR) for ITV were “only” down 23% but that compares well with a 43% fall in Q2. ITV noted that they are seeing new advertisers attracted by the falling prices (see below). Also good that some sectors that would have been disproportionately hit by the epidemic (Cars, Retail etc) are now returning to TV, along with FMCG. The more positive trend in TV backs up comments by AA / WARC in their recent statement;
As an aside, the UK looks to be having a worse time on TV ad revenues than the US. AMC, for example, noted that its national TV ad revenues were down 15% yoy (vs expectations of - 27% to -40%) and industry analysis has suggested national TV advertising revenues in the US are down only 9% for June;
ITV noted its TV prices (Station Average Pricing) were 50%-60% below pre-pandemic levels, showing just how far the crisis has driven price deflation (and which should attract advertisers). In nominal terms, ITV pricing is probably back where it was several decades ago (never mind real pricing);
ITV doesn’t split out its TV revenues vs Video on Demand (VOD) revenues. Later in the statement, though, it states VOD revenues were -3% in 1H, with Q1 being +26%. That implies VOD at c. -30-35% for Q2. Although the weighting is unclear, given total advertising revenues were down 43% in Q2, that implies actual TV advertising revenues were maybe down c.50%;
ITV looks to be reducing its programming budget for 2020 – ITV had been talking about c. £1bn programming costs for 2020 under revised plans, the statement makes reference to £960m;
Total TV minutage was up 7% year on year in 1H (this is for all TV, not just ITV), the first increase since 2011. ITV lost share to the BBC due to news coverage (which is reasonable) but its own Total Viewing was +4%. This includes VOD but the majority of extra viewing will be television. It made the point it saw particularly good gains in daytime viewing but it was impacted by Coronation Street / Emmerdale going to 3 shows a week and the rise of SVOD viewing, particularly amongst the young;
Nothing on Britbox UK subscribers except to say that its subscriber number is ahead of target. However, there is a clue in the Other revenue line where ITV says a majority of the £6m increase yoy is due to Britbox UK subscriptions. Whilst its complicated due to timing effects of when subscribers joined and the end of free trial dates, my estimate is that implies somewhere over 200,000 subs on average, which would imply the June end date is higher;
Britbox US looks to be growing well, with over 1.2m subscribers and is profitable;
One interesting comment in the Content section. Previously, ITV has always talked about its Studios organic revenue growth being 5% through the cycle. In the statement, ITV says its view is that the global content market will grow 3-5% pa, with drama growing more. It is unclear whether this implies a more bearish view on Content (if ITV is gaining share, then the two statements are compatible) but worth noting;
Net debt at £783m at end 1H vs £893m at YE. Some slight confusion in the statement. Upfront, ITV talks about reaching agreement to defer pension and tax contributions of £90m in 1H to later periods but then talks later about agreements to defer at least £150m of pension and tax payments out of 1H. Unclear which number is the right one.
Sellside? Sure. There’s not much. Liberum likes XP Power:
We expect XP Power’s earnings growth to accelerate from its 9% five-year average to 15%, which our analysis shows should drive a re-rating towards quality peers. Organic earnings growth is set to increase 2.5x to 11-12% as 350bps of margin expansion 2019-22E finally converts its leading sales growth into earnings, while strong FCF should drive further growth through bolt-on M&A. With 20% upside to our 5130p target price, we initiate with a BUY.
Key point: We forecast XP Power’s earnings CAGR to step up from its 9% five-year average to 15%, thereby moving from average to best in class relative to quality industrials.
Value drivers: Structural margin expansion should finally convert XP Power’s leading sales growth into earnings, with organic earnings growth increasing 2.5x to 11-12%, with M&A on top.
What market misses: Our peer group analysis shows how stronger earnings growth is the key for XP Power to re-rate towards quality industrials and more in line with its high EBIT and FCF margins.
Is there value? Earnings acceleration should drive a re-rating of the stock towards quality peer averages of 4.2x EV/sales and 22x EV/EBIT, which generates our target price of 5130p. BUY
Liberum’s less keen on PageGroup:
A very tough Q2 means that PageGroup has suffered more than peers in terms of H1 EBIT decline, despite strong cost control. Investment ahead of the recovery curve in Q3 puts further pressure on H2. We cut FY20E EBIT by 73% and FY21E by 21%. We no longer assume the resumption of special dividends in FY21E, given depressed FCF. Page remains well positioned to take market share, but it is too early to call the earnings inflection point. TP cut from 460p to 375p and we move from Buy to Hold.
Dialog Semiconductor’s down to “neutral” at UBS post results on Wednesday:
Following the recent share price performance (+>100% from March trough vs +>60% for the SOXX) driven by strong operational resilience along with sector multiple expansion, we believe the current valuation is full and we downgrade the stock to Neutral. Despite a transition period to diversify away from Apple (here) and a competitive portfolio, we believe this transition will take longer than expected due to Apple strength and slower growth in other products than previously thought. In this note we highlight three downside risks: 1) We analyse the Adesto acquisition (closed in June 20) and concludes that it will increase revenue volatility; 2) Despite being an interesting market with a strong portfolio in Bluetooth, we believe the company still lacks scale and it will take time to generate profitability; 3) We note that the recent performance has been mainly driven by Apple and now estimate Apple will represent c45% of revenues in 2022E vs company target 35-40% which is a key hurdle for further outperformance according to our analysis.
Based on a reverse DCF based on businesses excluding Apple main PMICs (as we know already it will disappear by 2022/23E), we work out what is currently priced in for the next five years of that business. We estimate the current share price implies new business revenues will grow at a 12% CAGR with an EBIT margin of 18% vs UBS estimates for a 12% revenue CAGR and an EBIT margin of 19%. From a risk/reward perspective, we now estimate a more balanced range with an upside of €69/share and €18/share for downside.
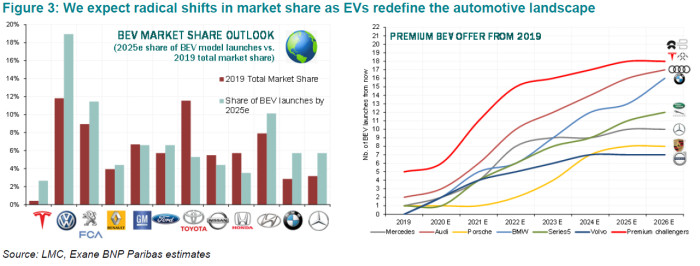
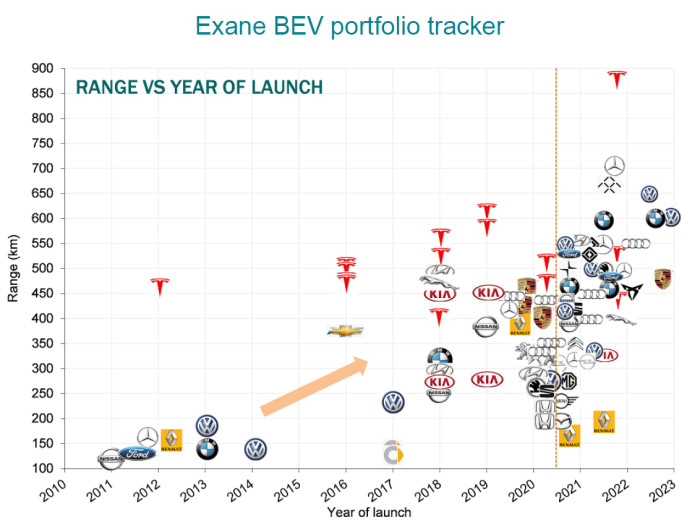
And Exane BNP Paribas has a monster note on electric cars that downgrades BMW and Schaeffler, raises Valeo and hikes its Tesla target to $1,550. “Your next car may not be electric. But the one after could well be”, it begins, before moving on to a dictionary definition of disruption. Better batteries mean electric vehicle margins will be above internal combustion within two to three years” meaning “dramatic market share shifts lie ahead”, it says:
The collision of a green new political era with the arrival of ‘million mile’ batteries is set to turn EV economics on its head. As EV residuals and margins rise above that of ICE, radical market share shifts lie ahead. We look for those that can thrive – and those that may struggle to survive.
Green New Politics: Europe’s New Deal meets a US Blue Wave
This autumn could mark a defining moment for decarbonisation as Europe’s Green New Deal and a potential US Blue Wave drive radical policy changes. We now expect Europe’s 2030 CO2 targets to be further tightened, with a review due by June 2021. To comply, we see European BEV penetration at 40% by 2030. Meanwhile a Biden Administration looks set to kick-start US EV adoption – the Democrats climate crisis plan even recommends 100% ZEV sales by 2035.
Million Mile Technology: A game changer for EV economics
2020 looks set to be the year that gives life to so-called ‘million mile’ batteries. The implications for EV total ownership cost benefits are significant. At a minimum this negates the need for a midlife battery replacement. But it may also drive an enhanced second life value to the battery that could support EV residual values materially. As EV residuals already start to move above that of ICE in many cases, we see margins outstripping that of ICE within the next 2-3 years.
Tesla (=) going exponential – BMW (= from +) in the firing line
A thriving EV market is set to drive dramatic market share shifts. We now see Tesla hitting 2m units by ‘25e (was 1.5m), driving an increased target price (to USD1550), but also a downgrade to BMW (+ to =) who looks set to be the last of the incumbent OEMs to arrive with a dedicated EV platform.
The electric supplier switch: To Valeo (+ from =) from Schaeffler (= from +)
Increasingly hungry for electrification plays, we expect investors to differentiate more abruptly between suppliers – favouring those such as Valeo (+ from =) with a leading electrified order intake, over others such as Schaeffler (= from +), still heavily geared into ICE fortunes.
• Updates follow, influenced or otherwise by requests and complaints in the comment box. A number of AV Telegram group chats are also available.
Comments